TLM stands for "Telemetry Monitor", and is our in-house display for PACE telemetry and housekeeping data. Its primary purpose is to display (and offer for download) various data about the PACE spacecraft, for example the temperature of certain components, or the voltage/current in certain instrument subsystems.
PerformanceAnecdotally, we have noticed that the app performs poorly on Safari, better on Firefox, and best using Chrome.

This interface shows a high-level overview of the daily summaries of instrument health status at a monthly basis. There is a color-coded legend indicating the day's overall health status as green, yellow, or red. These colors follow the conventions of the mnemonics green, yellow, and red value ranges that are assigned based on values received from telemetry. Green indicates nominal operations with telemetry values being within the limits. Yellow warns of a limit violation where a certain instrument health parameter is approaching out of limits, but still within operating levels. Red indicates a limit violation where a defined warning limit has been met or exceeded and is under investigation by the team.

You can view the details of the day's plots by clicking on one of the blocks of days on the calendar or navigating to the "Plots" link in the page's navigation. This will show the day's telemetries in detail with instrument mnemonics that you can choose from on the "selection" page (see below). The green daily block indicates nominal operations with telemetry values being within the limits. Yellow and red daily blocks indicate some kind of limit violation and will show plots of all telemetry with alarms.
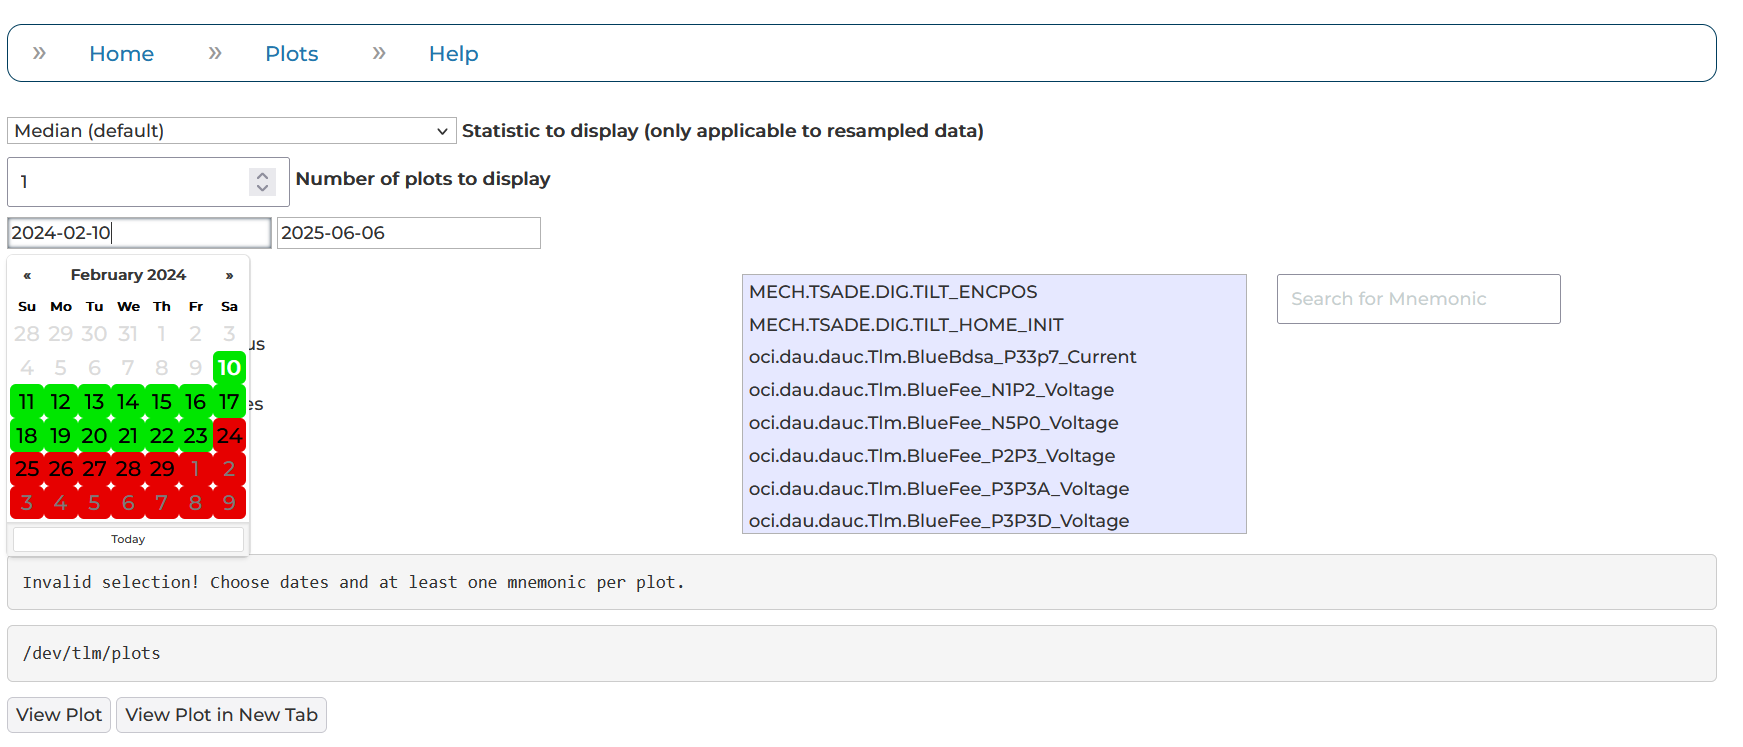
You can review a different day or multiple days' worth of Daily Plots by adjusting the queried time range in one of two ways. You can do this either by clicking on the calendar on the selection page (shown), or by specifying the date directly on the URL bar (described above). When manipulating the URL directly, add a date string prefix of "?strDate=" before the desired date or date range, which should be in the YYYY/MM/DD format. For example, "?strDate=20230816", is the convention showing the single 2023-08-16 daily plot, or "?strDate=20230816_20230901", for multiple days of telemetry plotted in the same plot.
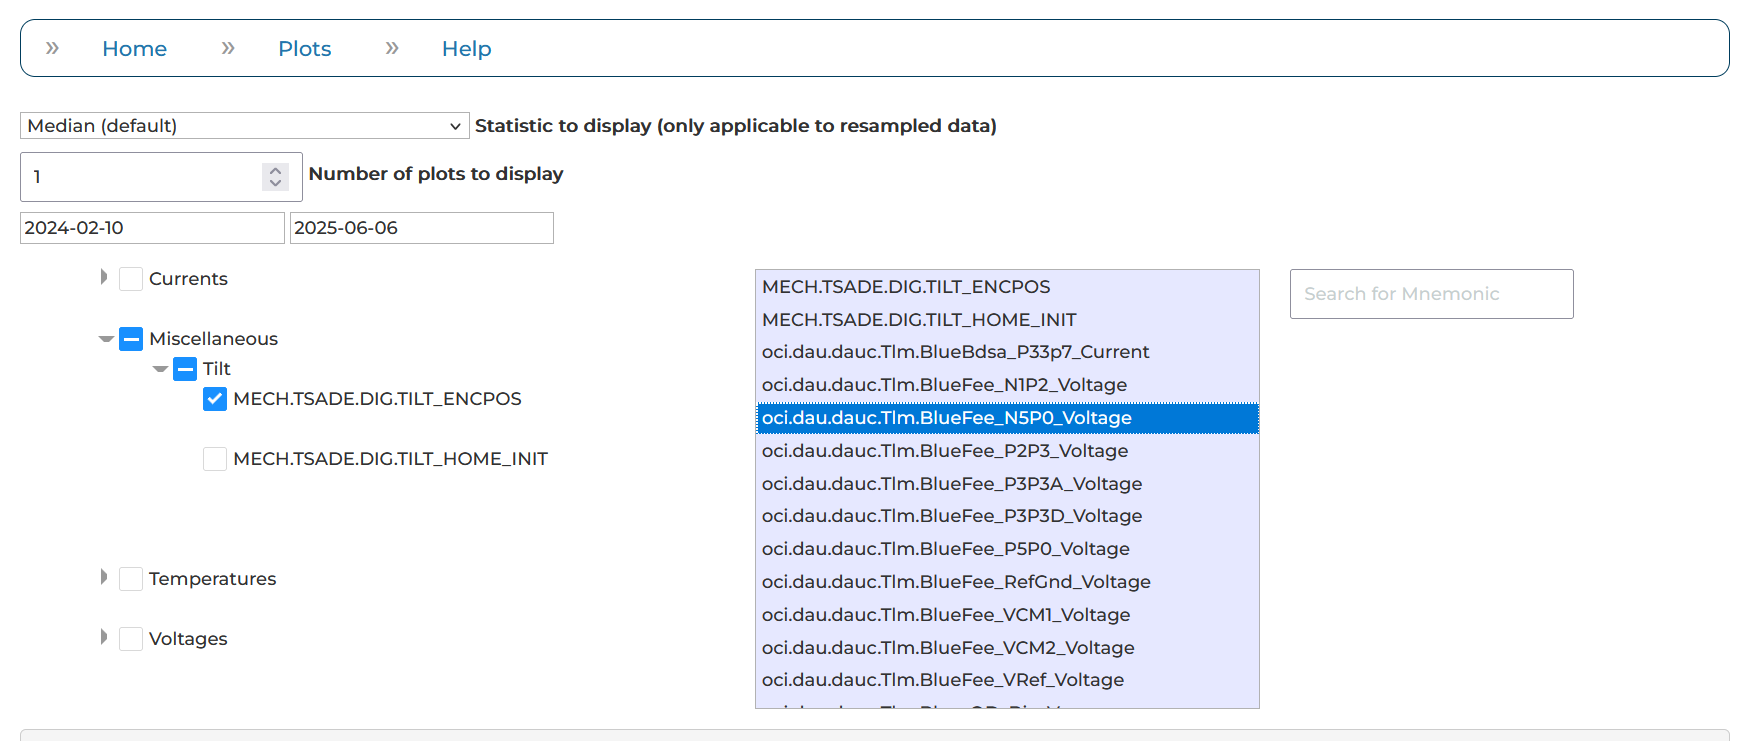
There are two ways in which you can choose the telemetries you'd like to plot. You can click the "Make New Plot" button and navigate the popup, using the drop-down menu to choose multiple mnemonics. Alternatively, you can specify directly in the URL bar after your indicated date(s). In the URL bar, you add the "&hkt=" convention before typing the names of the chosen mnemonics. Here's an example: "&hkt=oci.thrm.ptlm.temp.UvvisCcdRight;oci.thrm.ptlm.temp.UvvisCcdLeft"
The TLM tool resamples large datasets by default, in order to speed up the loading of the page. However, specifying "resample=false" in the URL will remove this option, showing all data without any downsampling.
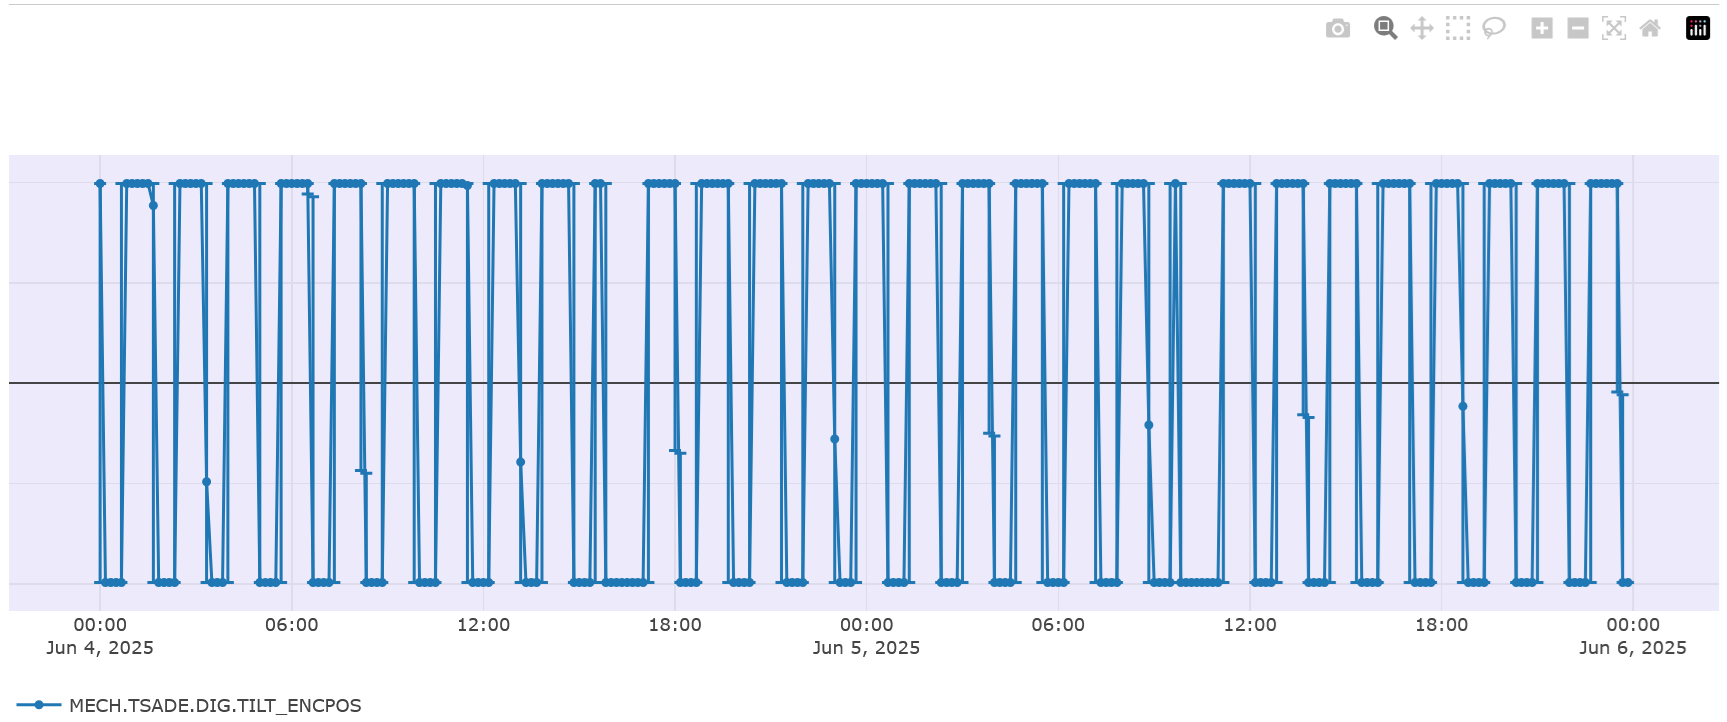
To save a plot to your computer, click the camera icon on the top right. To zoom horizontally along the timeline, choose your start time on the x-axis, click and hold the mouse's left button, pull horizontally until you reach your end time, and then release to refresh the plot with your new chosen time range. To zoom vertically, follow the steps as above, only pulling vertically along the y-axis instead of the horizontal x-axis. To restore the original plot scale, click "Home". You can also double click anywhere on the plot. To download the requested telemetry data as a .JSON file, click "Download" on the top left above the plot. Please note that downloading will return the entire dataset without resampling; this may be a large JSON file!
